
Collaborative BI is a trend that is beginning to gain momentum. The idea behind it is to make it easier for people in a company (or even outside of the company) to work together to analyze data and share analysis. There are several ways to accomplish this goal – from the simple to more complex.. The simplest is to provide an easy way to email an analysis. Another way to share analyses is to disseminate it via a web based interface. Or, multiple users can have access to the same web-based interface and use it to collaborate on a particular analysis project. They can share analysis and comment on the analysis.
The latter is the way in which a new entrant into the BI space – Good Data – is addressing the issue. I recently had an interesting conversation with Roman Stanek, CEO and founder of Good Data. The company will be releasing the full beta version of its SaaS solution in November.
So, what is Good Data all about? Good Data is a collaborative BI solution targeted at medium sized companies. The service allows users to upload structured data, analyze it, share and iterate on it. The company provides a beta version with sample data already loaded, so prospective users can get a feel for the service. Here’s what the service enables you to do:
- Upload the data: Good Data will take dump of a database in a flat file format (such as csv) and infer a model from the flat file. If the user doesn’t agree with the model, he or she can fix it. The file size is unlimited, but practically speaking it can be as large as several gigabytes. The user can upload as many files as he or she likes.
- Analyze the data. Good Data then allows users to slice and dice the data and report on it. Charts are also available and it handles time series data.
- Share and iterate on the data. Good Data provides a wiki-like interface so users can share their reports and charts and other users can comment on them.
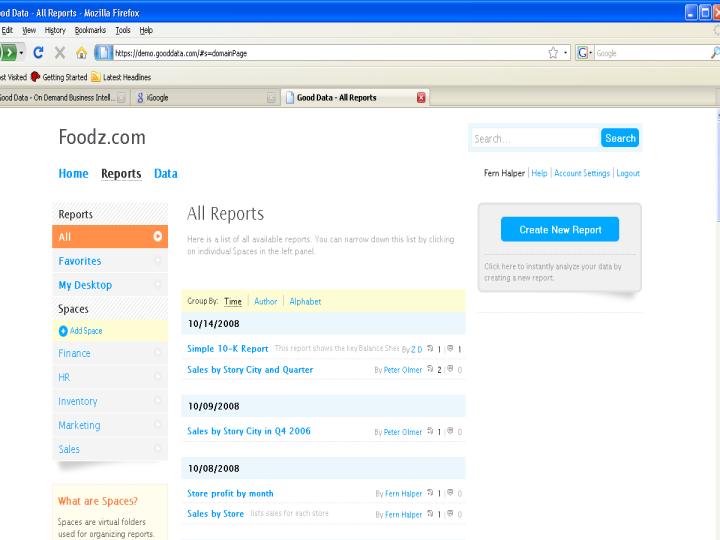
The service is really pre-beta at this point, so it doesn’t have all the bells and whistles. However, it was enough to get an idea of the direction that the company is going with the service. The beta comes with a data set about the food industry already installed, so I can’t comment on how easy it is to actually upload data or what happens if there is something wrong with the data. It was easy, however, to slice and dice the data to get reports and charts. There is a nice comment and annotation feature included in the service where the user can comment on a report authored by another person. The service also enables you to organize your analyses by category and you can see what updates, etc. have occurred on the analysis easily enough. The reports and plots can be exported to a PDF for XLS format. Here’s a screen shot from the reports web page:
The user starts a project and invites others to join. These people can generate reports that others can see (for example, I created some reports and Peter Olmer created some other reports). The reports are arranged by date and who created them. They can also be filed into one of the spaces on the left. If we look at the Sales by Store report we would see the following:
This report, of course, might open up a whole line of questions about each store’s performance (note the comment I inserted). The model that Good Data uses to capture the data allows the user to drill down into any of these stores for additional information about brands sold, staff, and any additional information that has been captured at the store level. This enables further slicing and dicing of the data.
Collaborative BI
Over the last year, I’ve seen a number of start-ups addressing various aspects of BI and trying to provide user-friendly solutions for small and mid-size companies. This is a good thing. The more people are exposed to data and analysis the more comfortable they’ll be with it. I like the collaborative idea behind Good Data and some of the tools that it has already built into the service. The company is planning the following set of collaborative features for the first release
· Collaboration around definition of report
· Collaboration around data model and definition of attributes/facts
· Collaboration around data/data quality
· Homepage feed of project activity
· Alerts & Notifications when data reaches pre-defined thresholds.
I’m looking forward to seeing the full beta and the real thing.
Collaborative BI and Good Data


Discover more from Fern Halper's data makes the world go 'round
Subscribe to get the latest posts sent to your email.
3 responses to “Collaborative BI and Good Data”
-
[…] report on Good Data in the context of collaborative BI. This is the kind of thing you see and ask: why nobody came with […]
-
[…] Fern Halper posted a short review about Good Data. The review focuses on the collaborative aspects of the service, and does a good job of explaining […]
-
[…] Collaborative BI and Good Data В« Fern Halper's data makes the … Oct 16, 2008 … Collaborative BI is a trend that is beginning to gain momentum. The idea behind it is to make it … […]

Leave a comment